
Google Analytics 4 (GA4) brings exciting new changes to the world of website analytics. This new software makes it much easier to track the website performance and keep you updated with how well you are performing.
However, users often find it challenging to locate and track their site speed metrics, which were previously found under the “site speed” section in the navigation. In this tutorial, we will explain why this metric is no longer available in GA4 and guide you on how to effectively track page load time manually in Google Analytics.
Tracking Page Load Time in GA4:
With the introduction of GA4, Google has changed the interface and reorganized certain metrics. With the new updates, the focus has shifted from general site speed to more specific user-centric measurements like page load time.
The reason behind this is simple. Google aims to provide a more comprehensive understanding of user experiences. Page load time is a serious factor in determining website performance and user satisfaction. By tracking this metric, you can identify areas for improvement and enhance your website’s overall user experience.
How to track Page Load Time in GA4:
Measuring the page load time can help you figure out how to keep your website user-friendly and ensure you get the required number of visitors. If you are confused how to find the option to track page load time in the Google Analytics 4 we are going to explain it to you.
Here is a step-by-step guide how you can track page load time in Google Analytics 4:
Step 1: Create a New Variable:
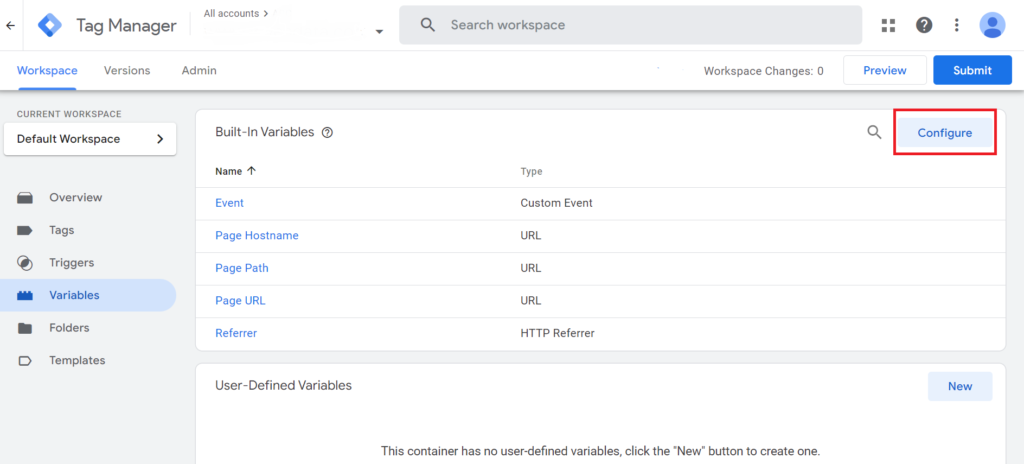
To create a variable first go to Google Tag Manager and log in. If you do not already have an account, you must first create an account. Once you have accessed your account, go to the Variable section. Under the ‘User-Defined Variables’ section click on ‘New’ to create a new variable.
Create a variable named ‘Page Load Time’ and while configuring add the custom Javascript code given below:
function() {
if (window.performance && window.performance.getEntriesByType) {
var entries = window.performance.getEntriesByType(“navigation”);
if (entries.length > 0) {
var navTiming = entries[0];
var pageLoadTime = navTiming.loadEventEnd – navTiming.startTime;
return Math.round(pageLoadTime / 100) / 10;
}
}
}
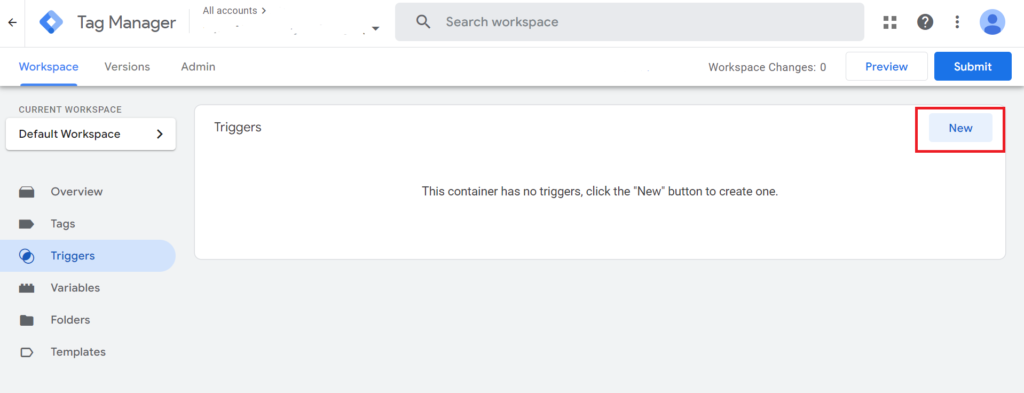
Step 2: Create New Triggers:
The next step is to create a new trigger. To do so, simply go to Triggers section on Google Tag Manager and click on ‘New’ to create a new trigger. When configuring it, you can name the trigger “Page Loaded” and select “Window Loaded” in the “Page View” Category in configuration settings.
You also need to create a second trigger to monitor if the Page Load Time is less than zero. After clicking ‘New’ in Triggers sections select “Custom Event” as the trigger type. Choose “Some Custom Events” as the trigger option. Now find the “Page Load Time” metric and create the condition “less than 0” and save the trigger.
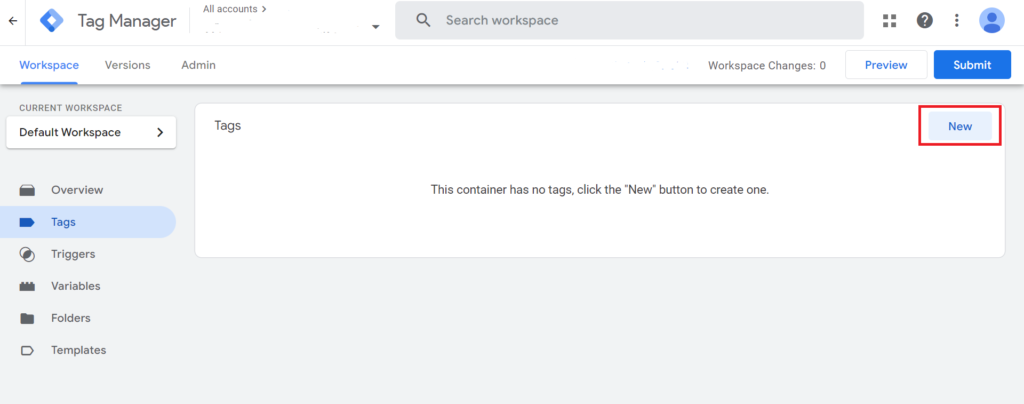
Step 3: Create New Tag:
Once you have set up your triggers, you can proceed to create a GA4 event tag. Go to the Tags section in Tag Manager and click on ‘New’. Choose “Tag Configuration” and select “Google Analytics: GA4 Event” as the tag type.
Select “None-Manually Set ID” option and manually enter the Measurement ID. You can name the event “page_load_time”. Now add the “loading_time_sec” in the “Parameter Name” field and “{{Page Load Time}}” in the “Value” field.
The final step is to select “Triggering” and designate the previously established “Page Load” as the “Firing Triggers.” Then, select the trigger you previously created “Page Load Time Less than 0”. You have now successfully created a new tag.
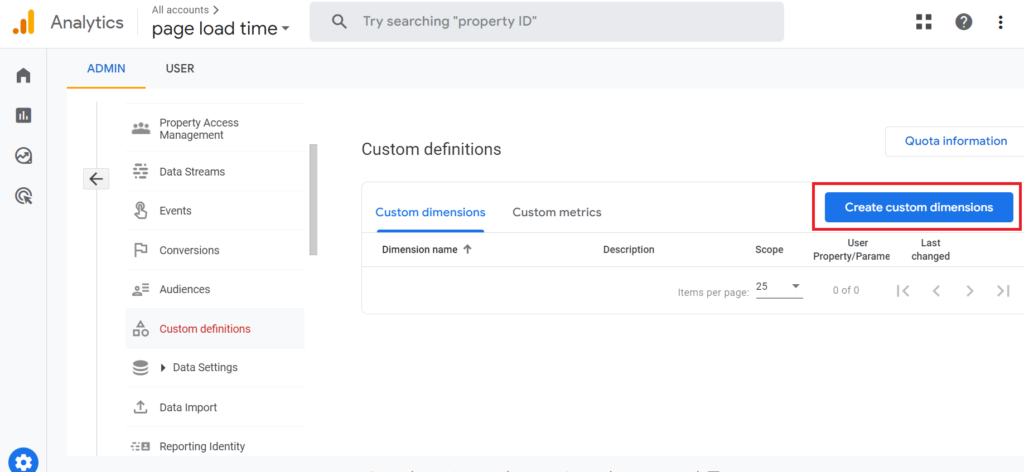
Step 4: Create New Metric:
After you have created the page_load_time event for Google Analytics 4, now you need to configure the loading_time_sec parameter in GA4. Go to Google Analytics 4 Admin panel and select ‘Custom Definitions’.
Go to ‘Create custom metrics’ and add the metric name: “Page Load Time”. Under Event parameter select “loading_time_sec”. Save the metric and publish your container. You are now ready to test your page load time metric in Google Analytics 4.
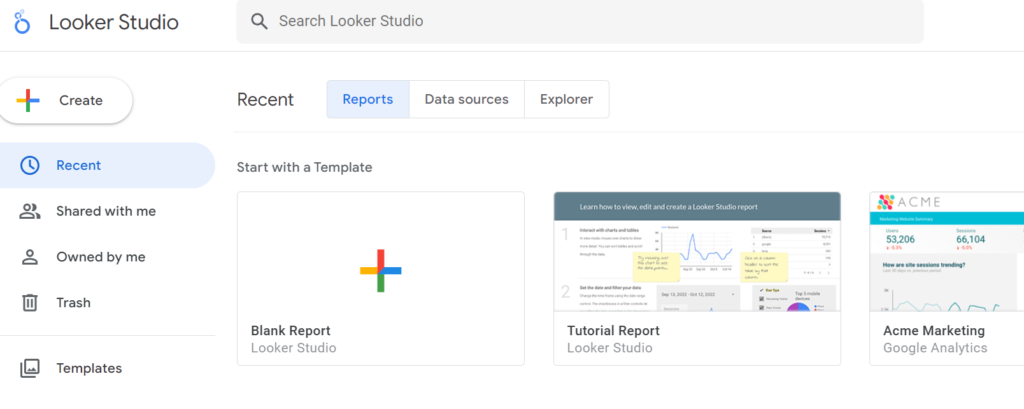
Step 5: Use Looker Studio:
To create a detailed report of performance of your website, we would recommend you to use the Looker Studio (previously known as the Google Data Studio”) Go to Explore and create a new blank report. Select the ‘Views’ metric and add the ‘Page Loading Time’ metric you have created in GA4 to the report. You can now see the page loading time and track its performance.
How to Use Page Load Time Metric:
Now that you have access to page load time metrics, you can use this information to enhance your website’s performance and optimize user experiences. Here is how you can use the page load time metrics in GA4:
- Identify Performance Bottlenecks:
Analyze the total page load time and related metrics to pinpoint areas where your website may be underperforming. Look for opportunities to optimize resource loading and reduce unnecessary delays.
- Compare Performance Across Pages:
Compare page load times across different pages on your website. Identify pages with slower load times and optimize them to improve overall user experience.
- Monitor Performance Over Time:
Track changes in page load time metrics over time to measure the effectiveness of your optimizations. Continuously monitor and address any performance regressions promptly.
Conclusion:
Although the “site speed” section is no longer present in GA4, tracking page load time is still possible. By following the steps outlined in this tutorial, you can easily locate and monitor page load time metrics in Google Analytics 4. Use this valuable information to optimize your website’s performance and provide an exceptional user experience.