Explore

Read articles about data & the internet

Analytics

Learn w/ guides, tutorials & videos

Shop

Digital art, dashboard templates & more

From Raw Data to Insights: The Journey of Effective Data Visualization

In today’s era of vast amounts of information, often referred to as big data, businesses are grappling with the challenge of extracting meaningful insights from a flood of raw data.  This is where the super blend of art and science known as data visualization comes into play.  As an expert on all things analytical here at dataandadoodle.com, I will delve

Read More »

Mastering Segmentation in Google Analytics: A Complete Guide

As a marketer, you probably already know the importance of tracking and analyzing data to optimize your campaigns.

And when it comes to data analysis, Google Analytics is one of the most popular and powerful tools out there, with a staggering 75 million users.

But did you know that you can take your analysis a step further with segmentation? By isolating specific subsets of your data, you can gain deeper insights into your audience and improve your targeting strategies.

In this comprehensive guide, we’ll walk you through everything you need to know to master segmentation in Google Analytics.

Analytics

How to track page load time in Google Analytics 4

How to Track Page Load Time in Google Analytics 4?

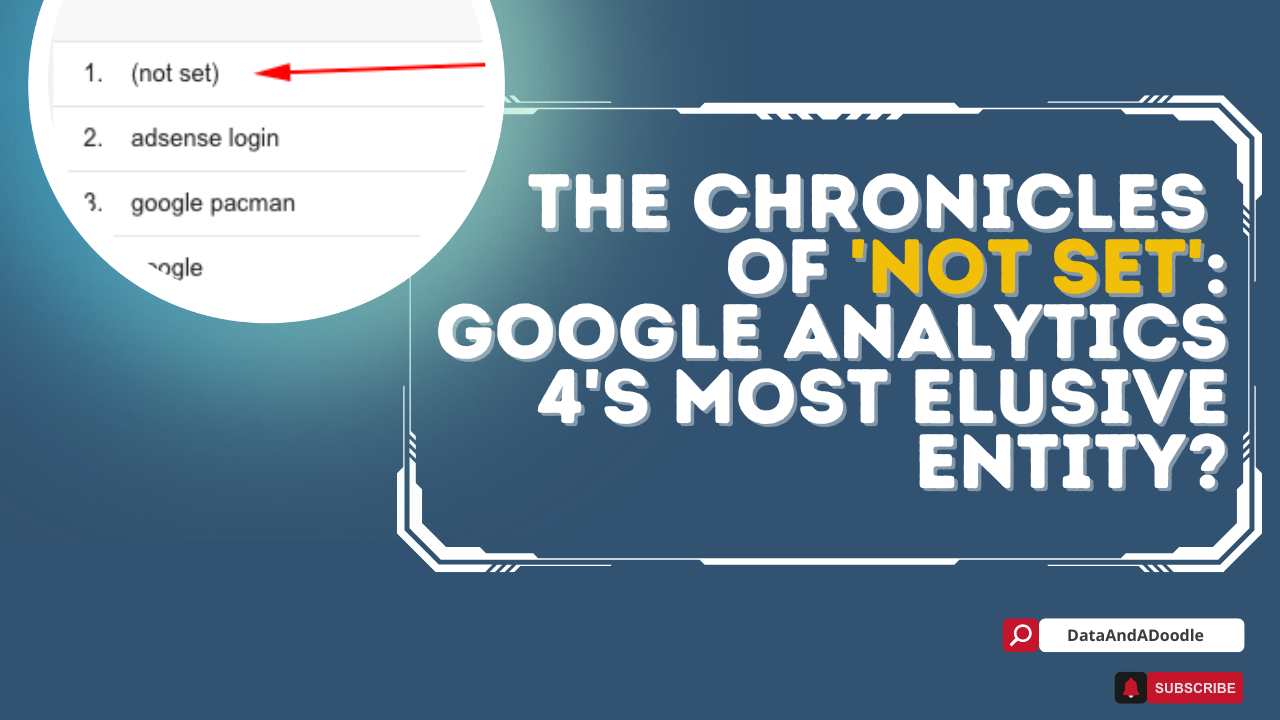
Wait, where did the site speed metrics go?
Fear not! Our comprehensive tutorial unveils the truth behind this vanished metric and equips you with the knowledge to manually track page load time in Google Analytics 4.

Read these before you go

Sharing is Caring

Split Genius: Mastering the art of A/B testing

Split Genius: Mastering the Art of A/B Testing

Discover all the basics & science behind A/B testing.  Learn the most common pitfalls and get helpful advice to make smarter choices.  

Ultimate Guide to Google Analytics 4

Discover advanced insights, master key features, and optimize your digital strategy with this essential resource.

Key Principles of Data Visualization

Key Principles of Data Visualization

From bar charts to heatmaps, this has you covered with tips, examples, and advice on when to use (or not use) each chart type.

Subscribe!

Subscribe and get the latest updates directly from our newsroom.